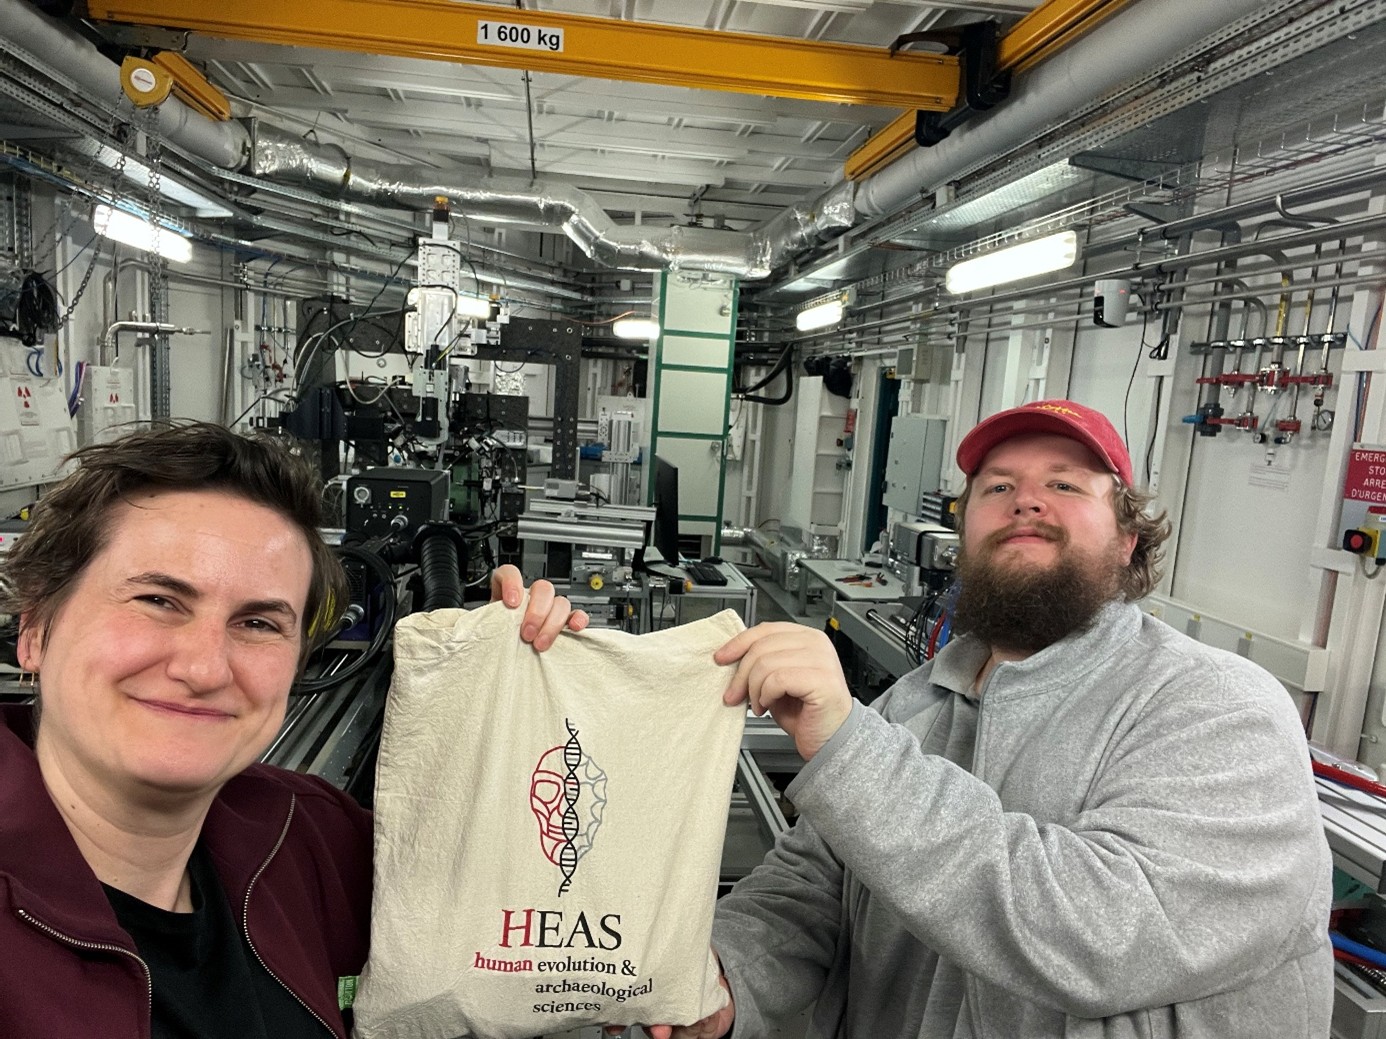
The MicroStratDNA Group visits the ESRF
More On Article
- Faces reveal accurate information about overhand throwing ability in men.
- First Austrian-led expedition presents finds from the "Cradle of Humankind"
- Where Physics, Chemistry and Archaeology Meet: Applications and Case Studies in (p)XRF
- Tiny Hopes─Assessing Protein Preservation in Collagen-Depleted Bones.
- It Takes Two to Tango: A Pluralist Account for Building Comprehensive Explanations in Human Evolution
By Thomas Beard
What is the ESRF?:
The European Synchrotron Radiation Facility (ESRF) is a circular particle accelerator that is capable of a varied range of radiation-based analyses, which in the ESRF’s own words makes it a “giant microscope”. A famous example of a synchrotron-like particle accelerator is that of the CERN Large Hadron Collider in Geneva, Switzerland. The ESRF works on the same principles as CERN but it is only speeding up the particles not trying to collide them. All synchrotrons use electromagnetic fields to propel ions to very high speeds with recent renovations at the ESRF giving it the brightest beam of any synchrotron facility in the world. Researchers based at a university in a country contributing to the ESRF project can use the facility for free, if their grant proposal is successful. If you are interested, I would suggest checking out the ESRF’s website, which has a lot of useful information and you can even see if your research would be possible at the facility.
Who and Why?:
One of the main aims of the MicroStratDNA group is to understand how ancient DNA (aDNA) preserves in archaeological cave sediments. Within current literature there are many theories about what the source of the aDNA could be including; bones, faecal matter or even DNA bound to minerals found throughout the sediments. There is a good possibility that all three will be included in even a small sediment sample of 50 milligrams! We are confident that we can extract the DNA from the bones and faecal matter, but it is still unclear if we are extracting aDNA from minerals. We know from previous laboratory experiments that free DNA can absorb to clay minerals, but this remains untested on clay from archaeological sites. A further complication is that different clay minerals have different adsorption potentials, so it would also be good to know which clay particles we have in our sediments. To investigate this, we need to be able to understand the sediment and soil dynamics at the nano-scale, beyond our usual microscopic approach, as both clay and DNA are very small particles. For some perspective clay grains are usually around 2 µm in size! Therefore, we wanted to investigate the different clay minerals that have been introduced during the normal site formation processes (in the form of soil/clay aggregates) and those introduced post-depositionally (in the form of clay illuviation) at the site of Satsurblia Cave (Georgia) where we have already recovered aDNA (Fig.1). To do this we needed to use some serious equipment with nanometre scale precision. Luckily such equipment does exist, such as the ESRF in Grenoble, France.
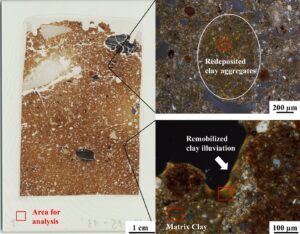
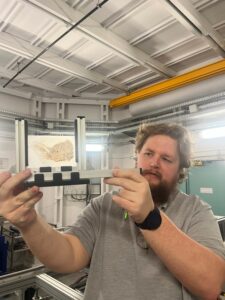
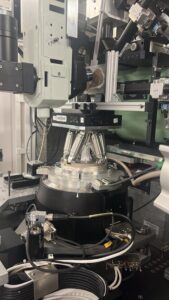
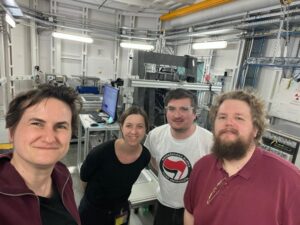
Fortunately, the grant submitted by Mareike Stahlschmidt, our collaborators Stanislav Jelavić and Zvonka Gveric (Fig 2.) from the University of Grenoble Alpes, and Manfred Burghammer at the ESRF, was accepted and we were given 4 days of beam time over the Easter weekend, sadly meaning we could not participate in any egg hunts this year. We wanted to use the microfocus beamline, which is capable of a beam size of 200 nano meters, to conduct nano-scale XRD analysis on our micromorphological thin sections. These thin sections consist of a 35 µm thick layer of undisturbed resin impregnated sediment stuck to a glass slide, which normally allows us to analyse archaeological sediments under a petrographic microscope to understand site formation processes. Even though micromorphological analysis allows us to identify clay in our thin sections we cannot distinguish clay grains from each other as they are usually around 2 µm in size. However, as the thin sections are around 35 µm thick, the clay grains obscure each other and become indistinguishable at the scales we are used to. To overcome this, we wanted to experiment with the nano-scale XRD capabilities of the synchrotron, which would allow us to determine if the clay minerals in the soil/clay aggregates were different to the clay minerals in the post depositional clay illuviation features (see Fig. 1). This is not possible with normal-scale XRD as separating out the grains would be impossible, and you would lose the context of the sample. Additionally, we already had these particles stuck in place on our thin sections with a very strong contextual understanding of the clay features. Distinguishing the difference between the clay in the matrix and in the soil/clay aggregates would allow us to understand the DNA intercalating capabilities of the clay minerals in these two different contexts and where the aDNA may be coming from.
Undertaking the Experiment:
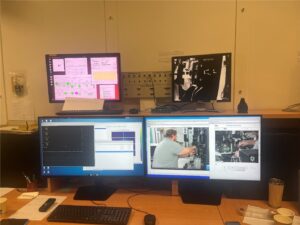
We spent most of our first day learning how to use the equipment with the amazing help of Georgina Robertson (we can’t thank Georgie enough for their amazing assistance). This was not a simple bench top machine, and everything had to be moved through a console using commands (Fig. 3). This was partially to make sure we had to think about moving each piece of machinery and not crashing the very expensive equipment into each other, but also as the experiment hutch would have high doses of radiation shot into it during the experiment and we could not be in there to move things. The ESRF team had 3D printed a mount for our slides (Fig. 4), which were (surprisingly) the largest samples they have ever measured! After mounting our thin section and getting it into place we carefully selected areas of interest measuring 60×90 µm within a 2×1 cm (the maximum area that the stage could move!) area on our thin sections (Fig. 5). Each area of interest took around 45 minutes to map, but we made sure to use up as much of our beam time as possible and got less sleep than we usually do. With a few minor hiccups, one being the beam being down for 2 hours during our allotted time and none of them directly caused by us, we managed to successfully carry out our experiment. Although we were able to do some on-site interpretation of our results, we still have a lot of data to process (around 25 terabytes!). Sorry to leave you without any results or a conclusion but you will have to keep an eye out for our future publications about the data!